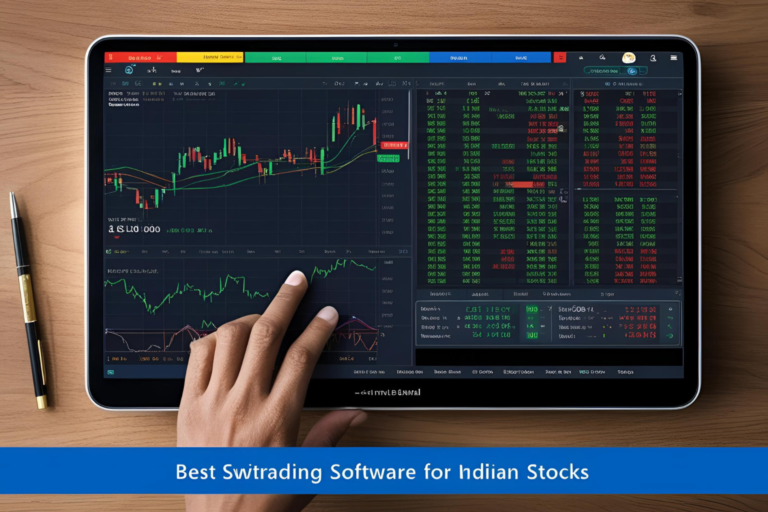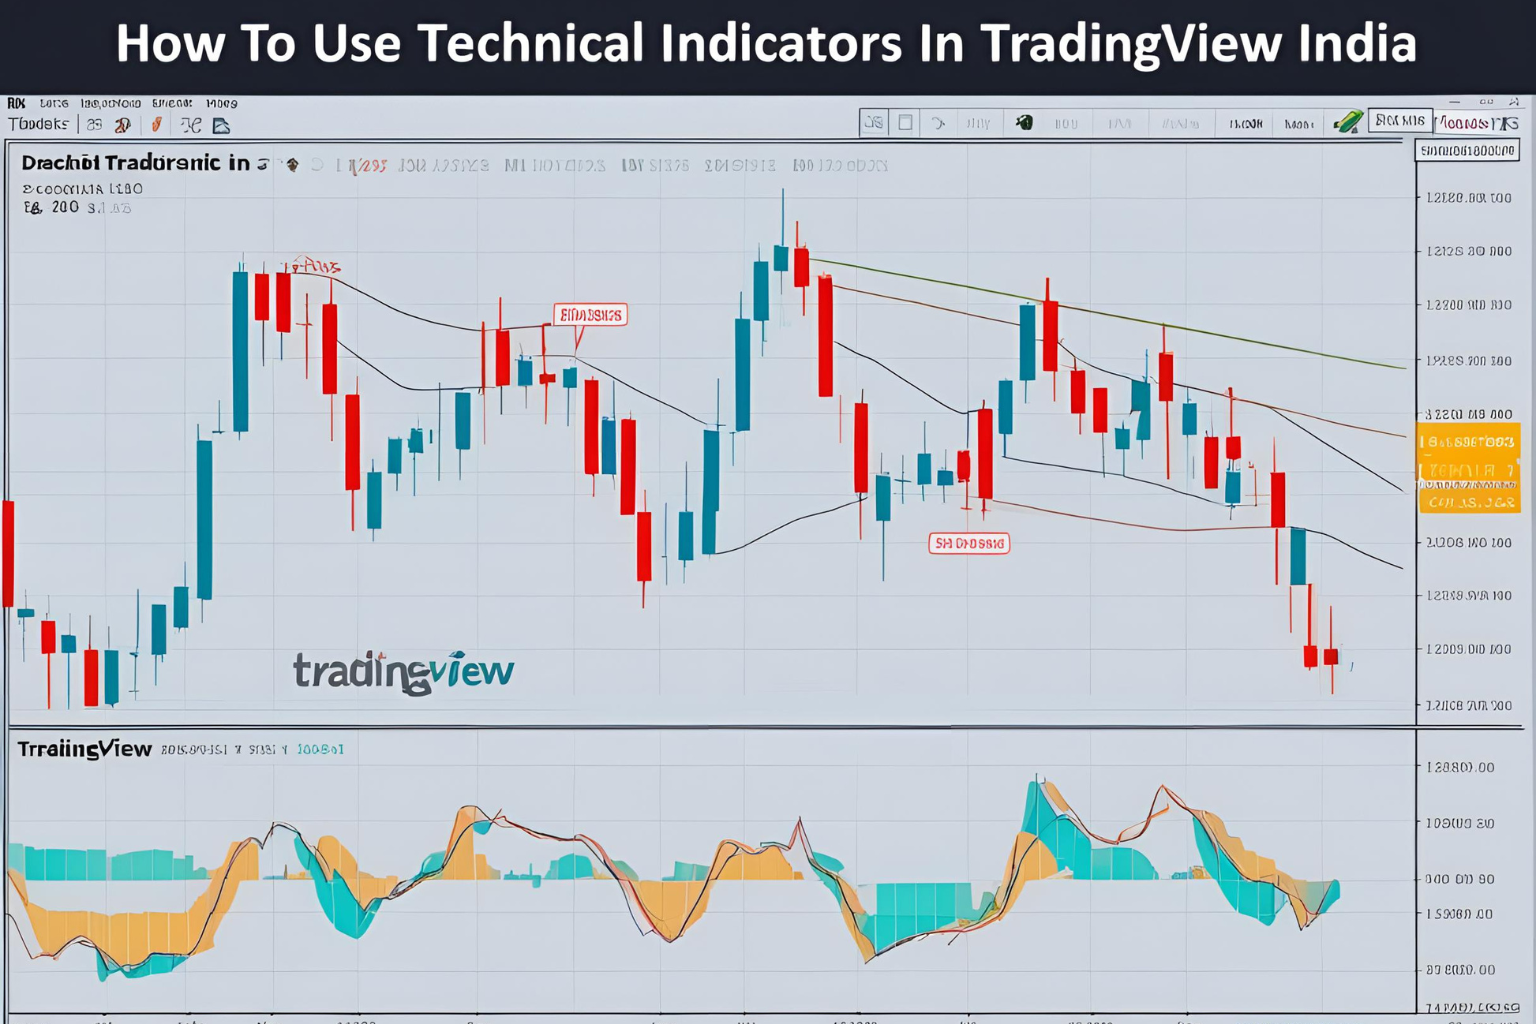
How to Use Technical Indicators in TradingView India
If you’re trading or investing in the Indian stock market, TradingView is one of the most powerful tools at your disposal. With its clean interface, advanced charting, and a vast library of technical indicators, it’s widely used by beginners and professionals alike. In this guide, we’ll show you how to use technical indicators effectively in TradingView India, especially for analyzing NSE-listed stocks.
What Are Technical Indicators?
Technical indicators are mathematical calculations based on a stock’s price, volume, or both. They help traders identify potential entry/exit points, trends, reversals, and momentum. Examples include Moving Averages, Relative Strength Index (RSI), MACD, Bollinger Bands, and many more.
Step-by-Step: Using Indicators in TradingView India
1. Open a Chart
- Visit in.tradingview.com
- Search for an NSE stock like RELIANCE, TCS, or NIFTY 50
- Click on the chart view
2. Add an Indicator
- Click the “Indicators” button at the top of the chart
- A search bar will open – type the indicator you want (e.g., RSI)
- Click on the name to apply it to the chart
3. Customize Indicator Settings
- Hover over the indicator on the chart
- Click the gear icon to adjust settings like period, style, and colors
- You can also save your template with these custom settings
4. Combine Multiple Indicators
- Add up to 3 indicators (in the free version) or unlimited (with Pro plans)
- Common combinations:
- RSI + Moving Averages
- MACD + Volume
- Bollinger Bands + EMA
Top 5 Indicators for Indian Stock Market Analysis
Here are some of the most popular and reliable indicators for TradingView India users:
| Indicator | Use Case | Default Setting |
|---|---|---|
| RSI (Relative Strength Index) | Identifies overbought/oversold conditions | 14 period |
| MACD | Trend-following + momentum | 12, 26, 9 |
| EMA (Exponential Moving Average) | Detects short- and long-term trends | 20, 50, 200 |
| Bollinger Bands | Measures volatility and breakout points | 20, 2 |
| Volume | Confirms breakout and price action | Standard |
Tips for Using Indicators on TradingView India
- Don’t rely on one indicator: Use a combination to confirm your trade setups.
- Avoid overloading the chart: Too many indicators can confuse rather than help.
- Backtest your strategy: Use TradingView’s replay and strategy tester tools to validate your approach.
- Save chart layouts: So you can reuse your favorite setups without redoing them.
TradingView India: Free vs Paid Plans for Indicators
| Feature | Free Plan | Pro Plan |
|---|---|---|
| Max Indicators on Chart | 3 | 5+ |
| Custom Scripts | Limited | Unlimited |
| Alerts | 1 | Multiple |
| Chart Layouts | 1 | 5+ |
If you’re a serious trader, upgrading to TradingView Pro may be worth it for access to more indicators, alerts, and real-time NSE data.
Final Thoughts
Learning how to use technical indicators in TradingView India is a crucial step in becoming a smarter trader. Start with simple indicators like RSI and Moving Averages, then experiment with combinations that fit your trading style. With time, you’ll be able to develop your own winning strategies using TradingView’s tools.
FAQs
1. Is TradingView India free to use?
Yes, the basic version is free and includes most core features. Paid plans offer more indicators, alerts, and advanced charting options.
2. Which indicators work best for intraday trading?
Popular choices include RSI (5 or 14), VWAP, MACD, and EMA (5/20) for intraday NSE stocks.
3. Can I use TradingView indicators on mobile?
Yes, TradingView’s mobile app supports indicators, although some features are more limited than the desktop version.
4. Are the indicators on TradingView accurate for Indian stocks?
Yes, TradingView integrates data from NSE/BSE and offers accurate technical indicator calculations for Indian stocks.
5. What is the best combination of indicators for beginners?
Start with RSI + EMA + Volume. These provide momentum, trend direction, and confirmation through volume.